All 195 countries, ranked
Sort by any column, filter by continent or search for a country. Every figure comes from the UN or the World Bank and is dated.
195 countries
| No. | Country | |||||||
|---|---|---|---|---|---|---|---|---|
| 1 |  India | 1.5B | 3,287,263 | 449 | $4T | $2,702 | 72.7 | 29.2 |
| 2 |  China | 1.4B | 9,600,000 | 147 | $19.5T | $13,862 | 79.0 | 40.6 |
| 3 |  United States of America | 349M | 9,833,517 | 35 | $30.8T | $90,027 | 79.8 | 38.7 |
| 4 |  Indonesia | 287.9M | 1,892,410 | 152 | $1.4T | $5,060 | 71.6 | 30.7 |
| 5 |  Pakistan | 259.3M | 796,096 | 326 | $407.3B | $1,596 | 68.1 | 20.8 |
| 6 |  Nigeria | 242.4M | 923,768 | 262 | $290.8B | $1,224 | 55.0 | 18.3 |
| 7 |  Brazil | 213.6M | 8,510,417 | 25 | $2.3T | $10,713 | 76.4 | 35.2 |
| 8 |  Bangladesh | 177.8M | 148,460 | 1,198 | $456.3B | $2,597 | 75.5 | 26.3 |
| 9 |  Russia | 143.4M | 17,098,246 | 8.4 | $2.6T | $17,547 | 73.7 | 40.7 |
| 10 |  Ethiopia | 138.9M | 1,104,300 | 126 | $126.4B | $933 | 68.1 | 19.3 |
| 11 |  Mexico | 133M | 1,964,375 | 68 | $1.8T | $13,889 | 75.6 | 30.0 |
| 12 |  Japan | 122.4M | 377,930 | 324 | $4.4T | $35,951 | 85.1 | 50.2 |
| 13 |  Egypt | 120.1M | 1,002,000 | 120 | $365.3B | $3,086 | 72.2 | 24.7 |
| 14 |  Philippines | 117.7M | 300,000 | 392 | $487.1B | $4,171 | 70.2 | 26.6 |
| 15 |  Democratic Republic of the Congo | 116.5M | 2,345,410 | 50 | $91B | $807 | 62.4 | 15.9 |
| 16 |  Vietnam | 102.2M | 331,345 | 308 | $514.7B | $5,066 | 75.0 | 33.9 |
| 17 |  Iran | 93.2M | 1,630,848 | 57 | $362.7B | $3,924 | 78.2 | 34.5 |
| 18 |  Türkiye | 87.9M | 783,562 | 112 | $1.6T | $18,599 | 78.4 | 33.9 |
| 19 |  Germany | 83.6M | 357,581 | 234 | $5.1T | $60,496 | 81.9 | 45.7 |
| 20 |  Tanzania | 72.6M | 947,303 | 77 | $90.1B | $1,319 | 67.6 | 17.6 |
| 21 |  Thailand | 71.6M | 513,140 | 139 | $577B | $8,057 | 77.1 | 41.0 |
| 22 |  United Kingdom | 69.9M | 244,376 | 286 | $4T | $57,602 | 81.7 | 40.2 |
| 23 |  France | 66.7M | 551,500 | 121 | $3.4T | $48,986 | 83.7 | 42.5 |
| 24 |  South Africa | 65.5M | 1,221,037 | 54 | $427.2B | $6,598 | 66.7 | 28.9 |
| 25 |  Italy | 58.9M | 302,068 | 195 | $2.6T | $43,309 | 84.2 | 48.6 |
| 26 |  Kenya | 58.6M | 591,958 | 99 | $135.9B | $2,363 | 64.2 | 20.3 |
| 27 |  Myanmar | 55.2M | 676,577 | 82 | $81.7B | $1,489 | 67.5 | 30.4 |
| 28 |  Colombia | 53.9M | 1,141,748 | 47 | $457.4B | $8,562 | 78.3 | 33.0 |
| 29 | 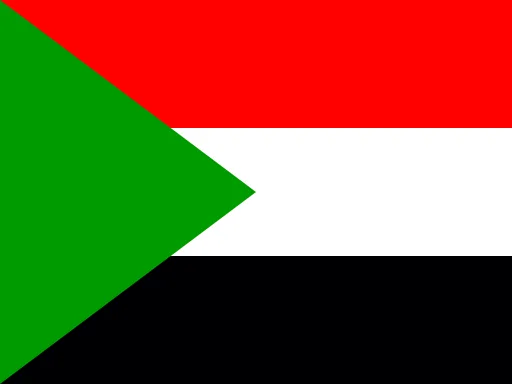 Sudan | 53.3M | 1,878,000 | 28 | $60.2B | $1,165 | 66.9 | 18.8 |
| 30 | 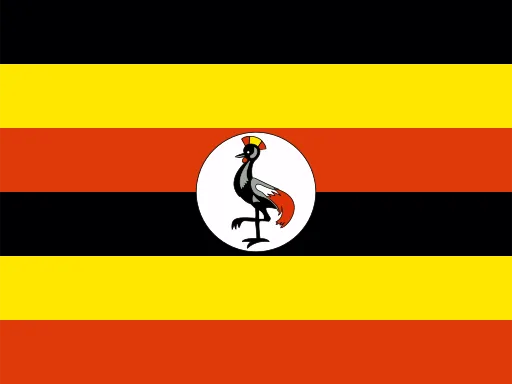 Uganda | 52.8M | 241,550 | 218 | $62B | $1,206 | 68.9 | 17.1 |
| 31 | 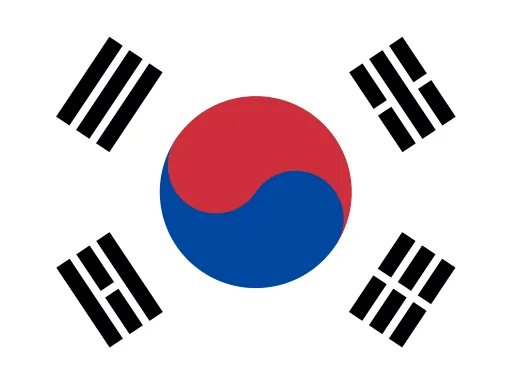 South Korea | 51.6M | 100,460 | 514 | $1.9T | $36,227 | 84.6 | 46.2 |
| 32 | 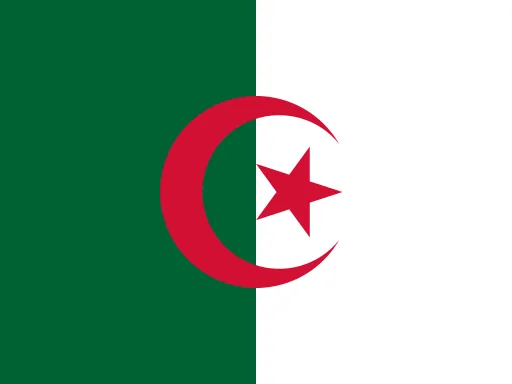 Algeria | 48M | 2,381,741 | 20 | $287B | $6,051 | 76.9 | 28.8 |
| 33 | 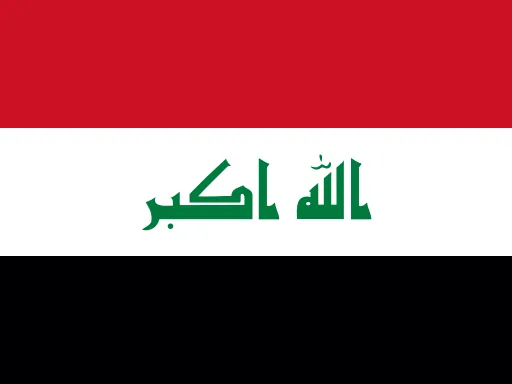 Iraq | 48M | 435,052 | 110 | $254.4B | $5,410 | 72.6 | 21.1 |
| 34 | 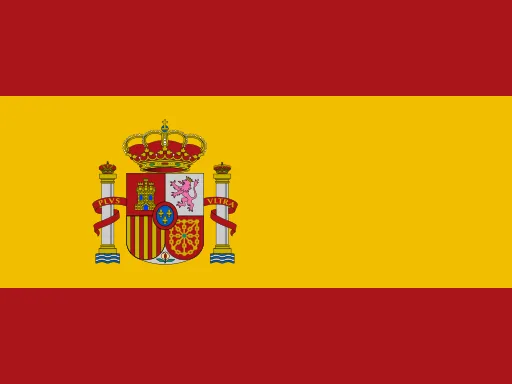 Spain | 47.9M | 506,009 | 95 | $1.9T | $38,627 | 84.1 | 46.3 |
| 35 | 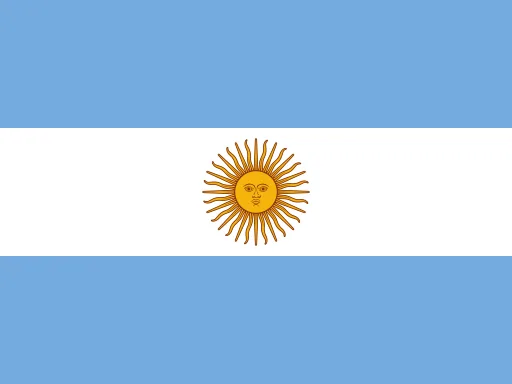 Argentina | 46M | 2,796,427 | 16 | $683.1B | $14,898 | 77.8 | 33.3 |
| 36 | 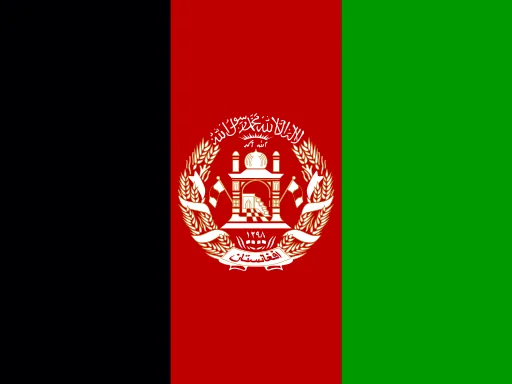 Afghanistan | 45M | 652,864 | 69 | $17.8B | $417 | 66.8 | 17.4 |
| 37 |  Yemen | 43M | 527,968 | 81 | – | – | 69.7 | 18.5 |
| 38 |  Canada | 40.5M | 9,984,670 | 4.1 | $2.3T | $55,698 | 83.1 | 40.8 |
| 39 |  Angola | 40.2M | 1,246,700 | 32 | $122.2B | $3,129 | 65.2 | 16.7 |
| 40 |  Ukraine | 39.5M | 603,500 | 66 | $214.2B | $5,866 | 75.0 | 41.8 |
| 41 |  Morocco | 38.8M | 446,550 | 87 | $182.4B | $4,672 | 75.9 | 30.1 |
| 42 |  Poland | 37.8M | 312,679 | 121 | $1T | $28,420 | 79.2 | 43.0 |
| 43 |  Uzbekistan | 37.7M | 448,969 | 84 | $147B | $3,968 | 72.8 | 27.0 |
| 44 |  Mozambique | 36.6M | 799,380 | 46 | $22.3B | $627 | 64.1 | 16.6 |
| 45 | 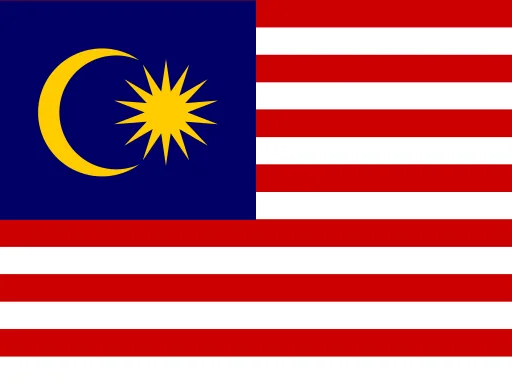 Malaysia | 36.4M | 330,621 | 110 | $472.2B | $13,125 | 77.2 | 31.4 |
| 46 | 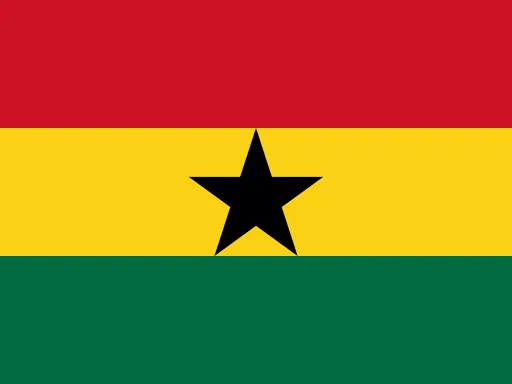 Ghana | 35.7M | 238,537 | 150 | $114.2B | $3,257 | 66.1 | 21.6 |
| 47 | 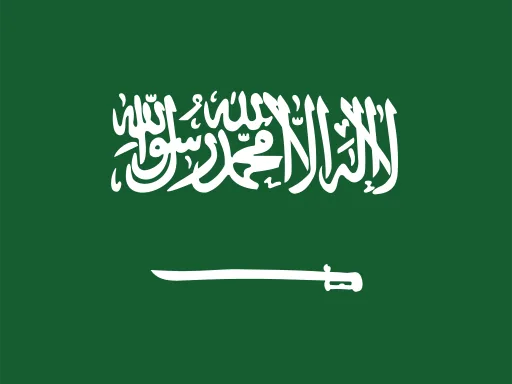 Saudi Arabia | 35.2M | 2,206,714 | 16 | $1.3T | $34,537 | 79.4 | 29.7 |
| 48 | 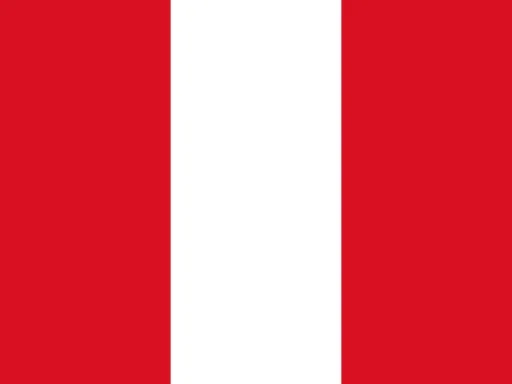 Peru | 34.9M | 1,285,216 | 27 | $334.9B | $9,684 | 78.3 | 30.5 |
| 49 | 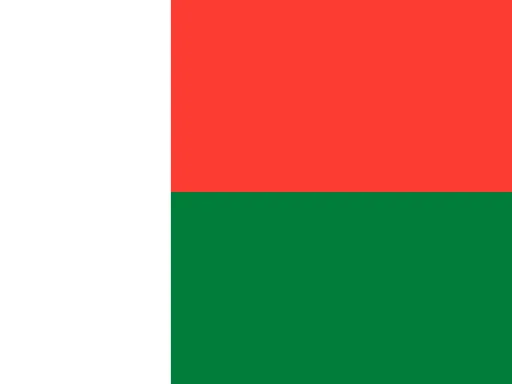 Madagascar | 33.5M | 587,041 | 57 | $19.6B | $599 | 64.3 | 19.4 |
| 50 | 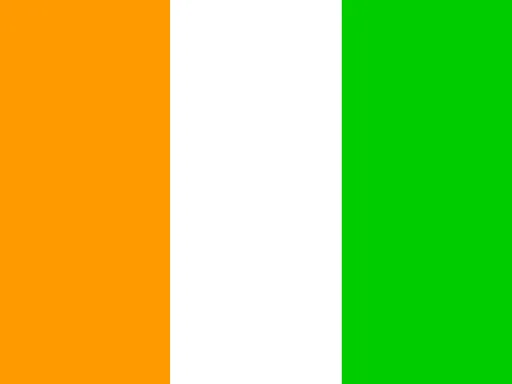 Côte d'Ivoire | 33.5M | 322,462 | 104 | $99.8B | $3,050 | 62.4 | 18.5 |
| 51 | 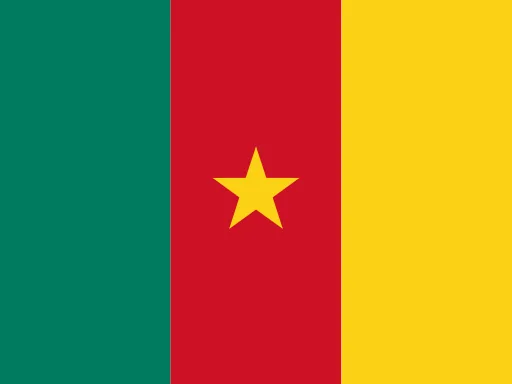 Cameroon | 30.6M | 475,650 | 64 | $58.9B | $1,972 | 64.5 | 18.2 |
| 52 | 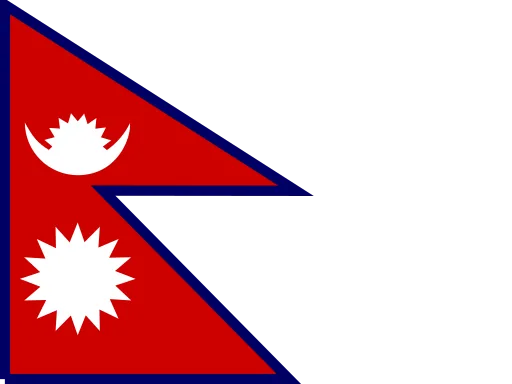 Nepal | 29.6M | 147,181 | 201 | $45.5B | $1,536 | 71.2 | 25.7 |
| 53 |  Niger | 28.8M | 1,267,000 | 23 | $21.6B | $775 | 61.9 | 15.7 |
| 54 |  Venezuela | 28.6M | 929,690 | 31 | $99.7B | $3,495 | 73.0 | 29.5 |
| 55 |  Australia | 27.2M | 7,692,024 | 3.5 | $1.8T | $65,130 | 84.3 | 38.5 |
| 56 |  North Korea | 26.6M | 120,538 | 221 | – | – | 74.0 | 36.8 |
| 57 | 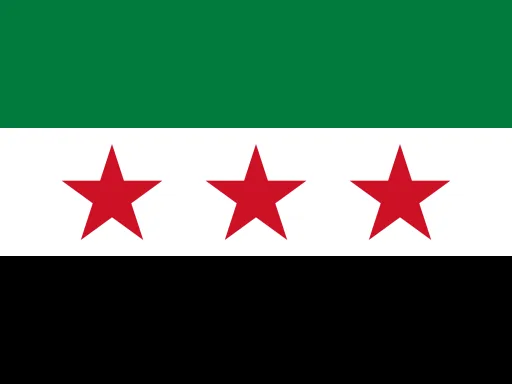 Syria | 26.5M | 185,180 | 143 | $23.7B | $1,057 | 73.4 | 23.8 |
| 58 | 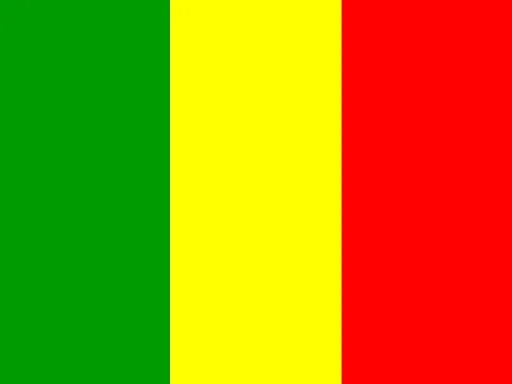 Mali | 25.9M | 1,240,192 | 21 | $30.1B | $1,193 | 61.1 | 15.9 |
| 59 | 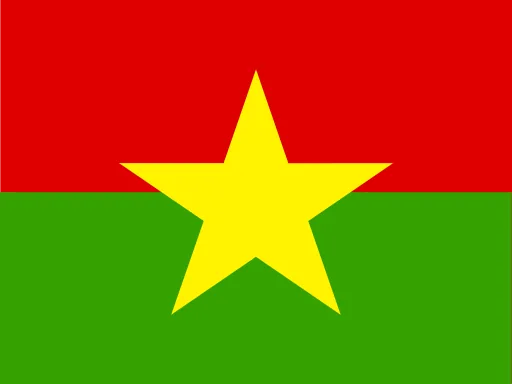 Burkina Faso | 24.6M | 272,969 | 90 | $27.6B | $1,148 | 61.6 | 18.0 |
| 60 | 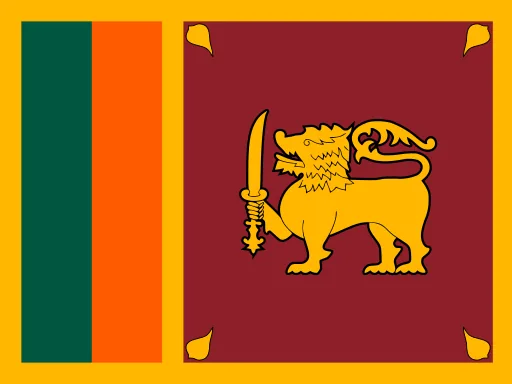 Sri Lanka | 23.3M | 65,610 | 356 | $108.8B | $5,002 | 78.0 | 33.6 |
| 61 |  Malawi | 22.8M | 117,726 | 194 | $14.9B | $672 | 67.9 | 18.4 |
| 62 |  Zambia | 22.5M | 752,612 | 30 | $28.9B | $1,318 | 66.9 | 18.2 |
| 63 |  Chad | 21.6M | 1,284,000 | 17 | $21.5B | $1,022 | 55.6 | 15.7 |
| 64 |  Kazakhstan | 21.1M | 2,724,910 | 7.7 | $306.2B | $14,692 | 74.8 | 29.7 |
| 65 |  Somalia | 20.3M | 637,657 | 32 | $13B | $661 | 59.3 | 15.6 |
| 66 |  Chile | 19.9M | 756,102 | 26 | $357.4B | $17,995 | 81.7 | 37.4 |
| 67 |  Senegal | 19.4M | 196,712 | 98 | $37B | $1,955 | 69.4 | 19.8 |
| 68 |  Guatemala | 19M | 108,889 | 174 | $123.3B | $6,598 | 73.0 | 23.8 |
| 69 |  Romania | 18.8M | 238,398 | 79 | $428.7B | $22,538 | 76.4 | 43.5 |
| 70 |  Netherlands | 18.4M | 41,543 | 444 | $1.3T | $73,684 | 82.6 | 41.5 |
| 71 |  Ecuador | 18.4M | 257,215 | 72 | $130.3B | $7,125 | 77.9 | 29.7 |
| 72 |  Cambodia | 18.1M | 181,035 | 100 | $51.3B | $2,872 | 71.1 | 26.4 |
| 73 |  Zimbabwe | 17.3M | 390,757 | 44 | $51.2B | $3,021 | 63.6 | 18.3 |
| 74 |  Guinea | 15.4M | 245,836 | 63 | $28.3B | $1,877 | 61.2 | 18.5 |
| 75 |  Benin | 15.2M | 114,763 | 132 | $24.6B | $1,658 | 61.3 | 18.2 |
| 76 |  Rwanda | 14.9M | 26,338 | 565 | $16.4B | $1,124 | 68.5 | 20.2 |
| 77 | 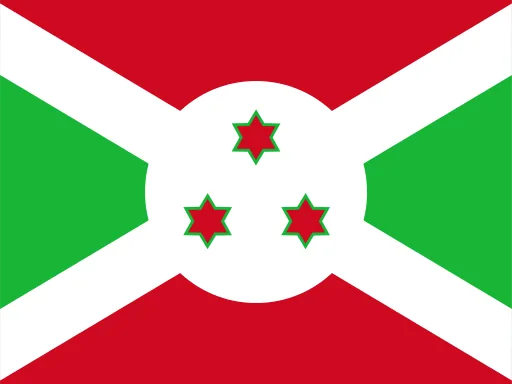 Burundi | 14.7M | 27,834 | 529 | $3.4B | $234 | 64.1 | 16.6 |
| 78 | 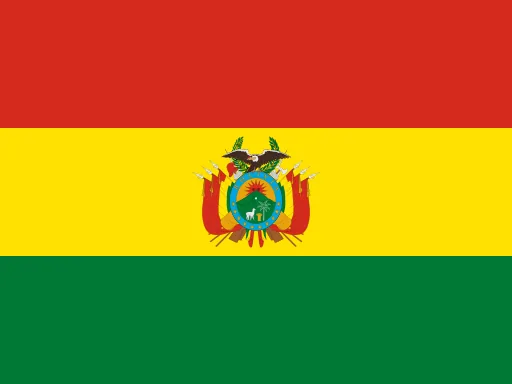 Bolivia | 12.7M | 1,098,581 | 12 | $64.8B | $5,148 | 69.1 | 25.5 |
| 79 | 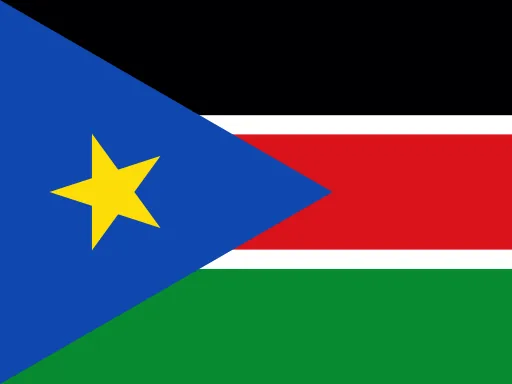 South Sudan | 12.4M | 658,841 | 19 | – | – | 58.0 | 19.0 |
| 80 | 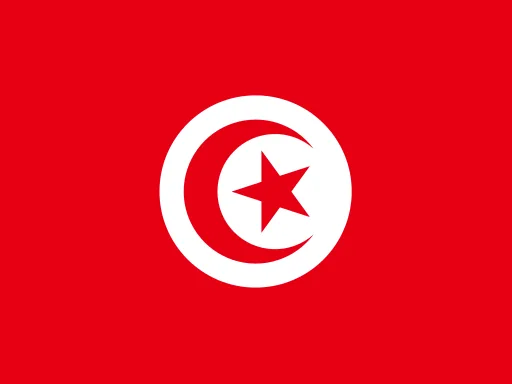 Tunisia | 12.4M | 163,610 | 76 | $57.5B | $4,657 | 77.1 | 33.4 |
| 81 | 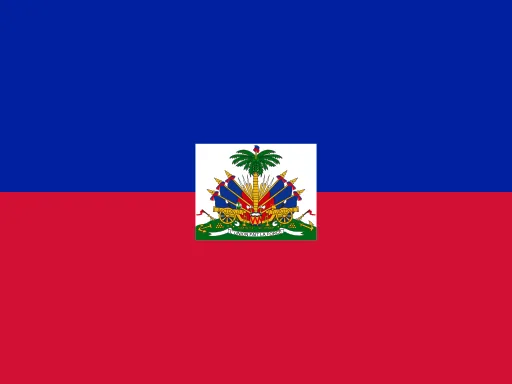 Haiti | 12M | 27,750 | 434 | $32.1B | $2,694 | 65.5 | 24.3 |
| 82 | 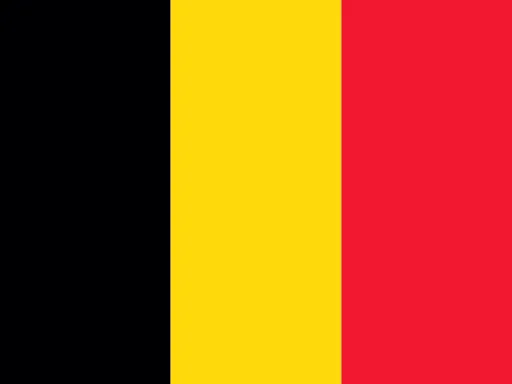 Belgium | 11.8M | 30,528 | 386 | $725.5B | $60,750 | 82.6 | 42.1 |
| 83 | 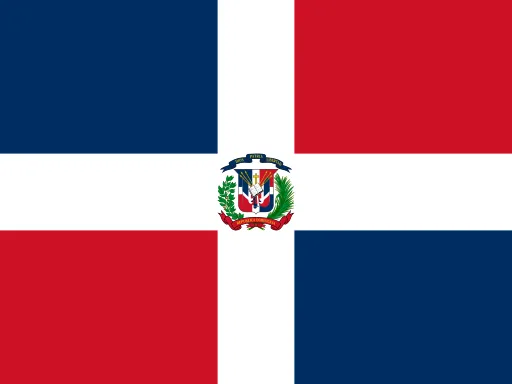 Dominican Republic | 11.6M | 48,671 | 239 | $127.4B | $11,059 | 74.1 | 28.7 |
| 84 | 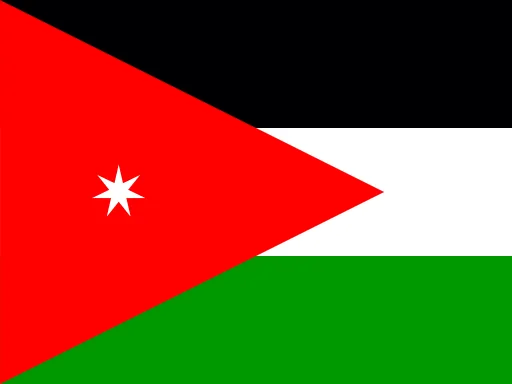 Jordan | 11.6M | 89,318 | 130 | $61.6B | $5,348 | 78.3 | 24.9 |
| 85 |  United Arab Emirates | 11.6M | 71,024 | 163 | $552.3B | $50,274 | 83.4 | 31.6 |
| 86 |  Honduras | 11.2M | 112,492 | 99 | $39.6B | $3,598 | 73.4 | 24.6 |
| 87 |  Tajikistan | 11M | 141,400 | 78 | $17.7B | $1,637 | 72.2 | 22.4 |
| 88 |  Papua New Guinea | 10.9M | 462,840 | 24 | $32.5B | $3,020 | 66.5 | 23.0 |
| 89 | 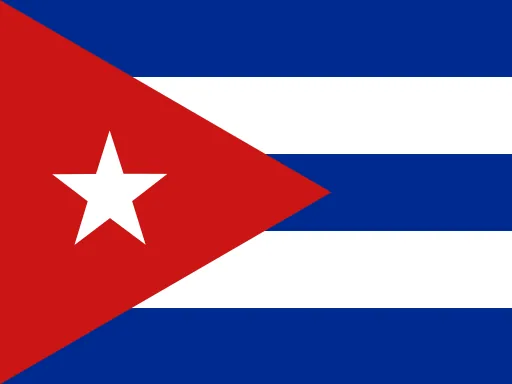 Cuba | 10.9M | 109,884 | 99 | – | – | 78.6 | 42.5 |
| 90 | 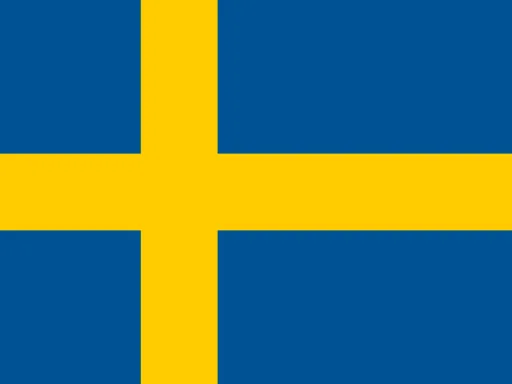 Sweden | 10.7M | 438,574 | 24 | $669B | $63,133 | 83.7 | 40.4 |
| 91 | 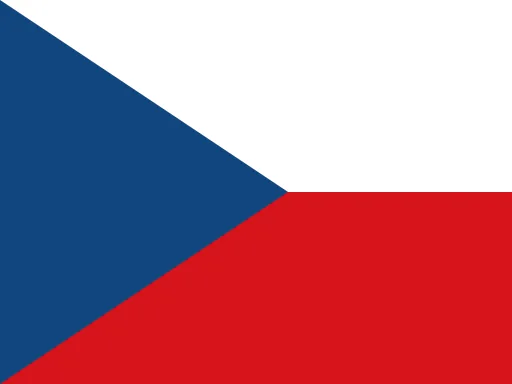 Czechia | 10.5M | 78,871 | 133 | $391B | $35,917 | 80.3 | 44.3 |
| 92 | 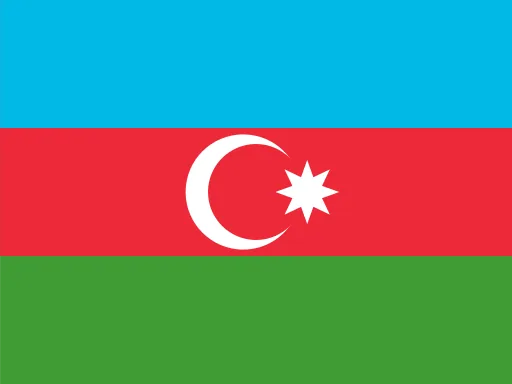 Azerbaijan | 10.5M | 86,600 | 121 | $75.9B | $7,411 | 74.9 | 34.1 |
| 93 |  Portugal | 10.4M | 92,225 | 113 | $346.6B | $32,082 | 82.9 | 47.2 |
| 94 |  Togo | 9.9M | 56,785 | 175 | $11.9B | $1,384 | 63.3 | 19.2 |
| 95 |  Greece | 9.9M | 131,957 | 75 | $280.6B | $26,948 | 82.4 | 47.1 |
| 96 |  Israel | 9.6M | 22,072 | 437 | $610.8B | $60,337 | 82.9 | 29.3 |
| 97 |  Hungary | 9.6M | 93,025 | 103 | $246.5B | $25,907 | 77.5 | 44.2 |
| 98 |  Austria | 9.1M | 83,878 | 109 | $579.5B | $62,930 | 82.5 | 43.9 |
| 99 |  Switzerland | 9M | 41,291 | 218 | $1T | $114,769 | 84.4 | 43.2 |
| 100 |  Sierra Leone | 9M | 72,300 | 124 | $7.5B | $846 | 62.3 | 19.9 |
| 101 |  Belarus | 8.9M | 207,600 | 43 | $93.4B | $10,279 | 75.0 | 41.8 |
| 102 |  Laos | 8M | 236,800 | 34 | $18.3B | $2,325 | 69.7 | 25.3 |
| 103 |  Turkmenistan | 7.7M | 488,100 | 16 | $49.8B | $6,540 | 70.5 | 27.3 |
| 104 |  Libya | 7.5M | 1,676,198 | 4.5 | $48.1B | $6,449 | 75.2 | 28.0 |
| 105 |  Kyrgyzstan | 7.4M | 199,949 | 37 | $22.6B | $3,081 | 72.1 | 25.5 |
| 106 | 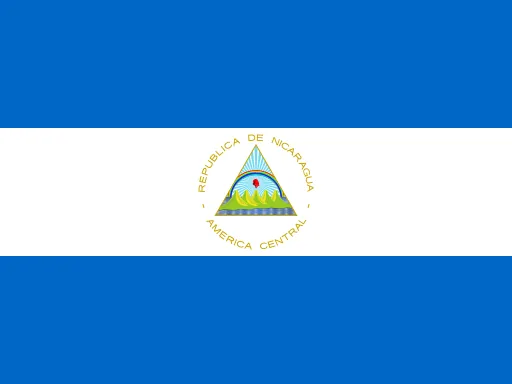 Nicaragua | 7.1M | 130,374 | 54 | $22.2B | $3,173 | 75.4 | 26.3 |
| 107 | 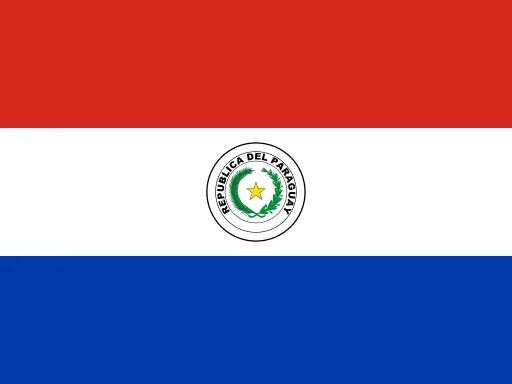 Paraguay | 7.1M | 406,752 | 17 | $49.3B | $7,027 | 74.2 | 27.3 |
| 108 | 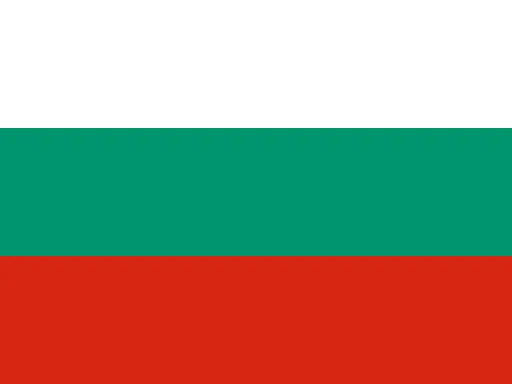 Bulgaria | 6.7M | 110,372 | 60 | $130.8B | $20,328 | 76.1 | 45.0 |
| 109 | 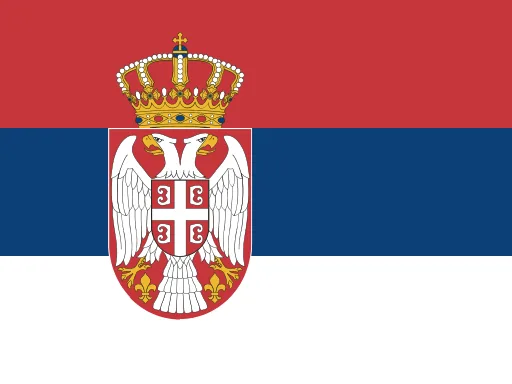 Serbia | 6.6M | 88,444 | 75 | $100B | $15,262 | 77.3 | 44.7 |
| 110 |  Republic of the Congo | 6.6M | 342,000 | 19 | $16.3B | $2,515 | 66.4 | 18.7 |
| 111 | 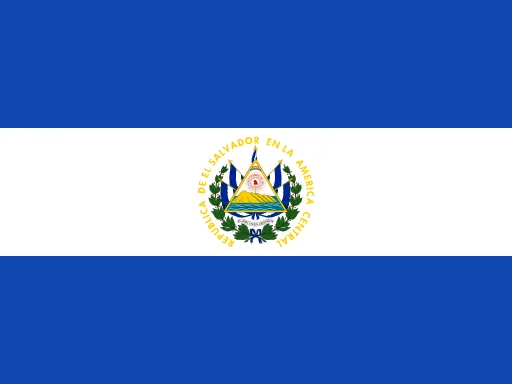 El Salvador | 6.4M | 21,041 | 304 | $36.7B | $5,767 | 72.7 | 28.4 |
| 112 | 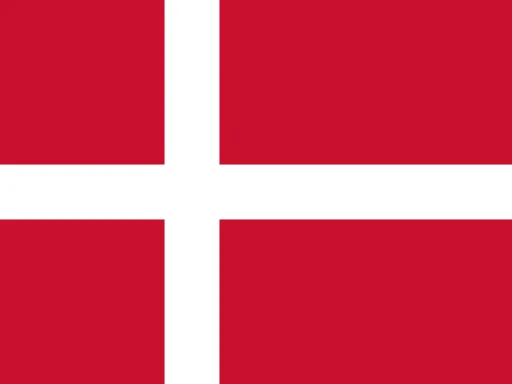 Denmark | 6M | 42,947 | 140 | $462.5B | $76,970 | 82.4 | 41.3 |
| 113 | 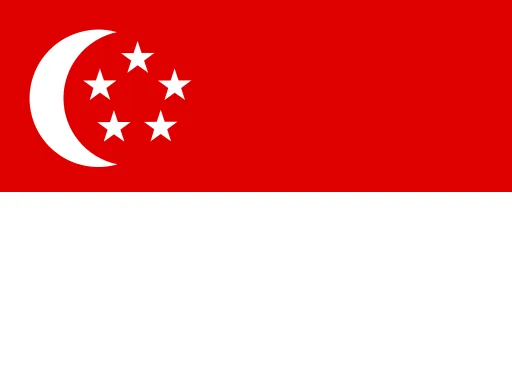 Singapore | 5.9M | 736 | 8,028 | $603.9B | $98,814 | 84.1 | 36.8 |
| 114 | 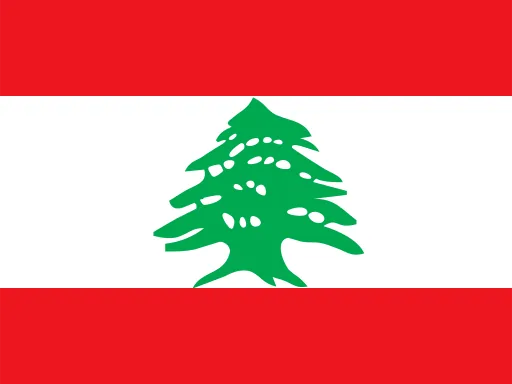 Lebanon | 5.9M | 10,452 | 564 | $26B | $4,473 | 78.2 | 29.0 |
| 115 | 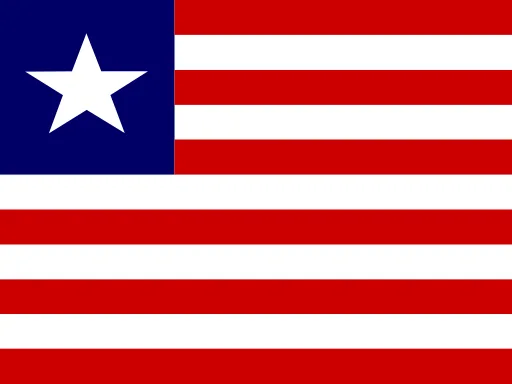 Liberia | 5.9M | 111,369 | 53 | $5.2B | $915 | 62.6 | 19.0 |
| 116 | 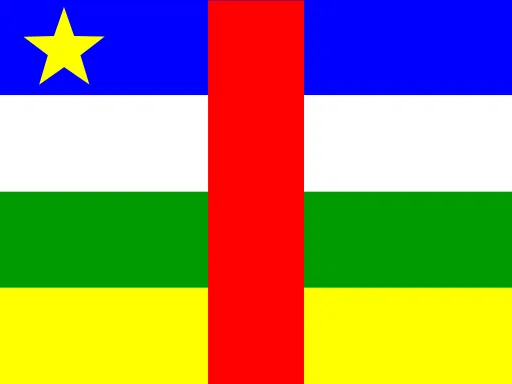 Central African Republic | 5.7M | 622,984 | 9.1 | $3.1B | $556 | 58.2 | 14.6 |
| 117 | 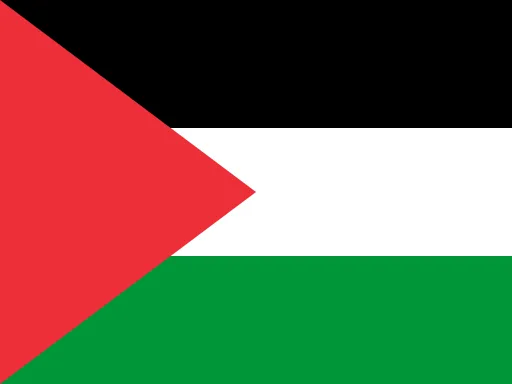 Palestine | 5.7M | 6,020 | 946 | $17.2B | $3,171 | 77.4 | 20.3 |
| 118 | 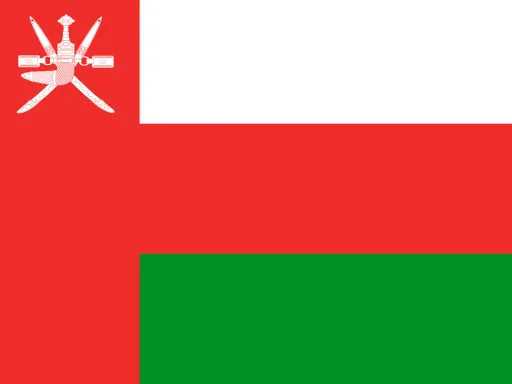 Oman | 5.7M | 309,980 | 18 | $109.6B | $19,947 | 80.7 | 29.8 |
| 119 | 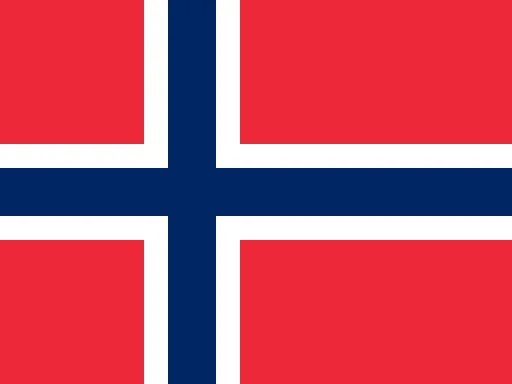 Norway | 5.7M | 323,772 | 17 | $530.8B | $94,594 | 83.8 | 40.1 |
| 120 | 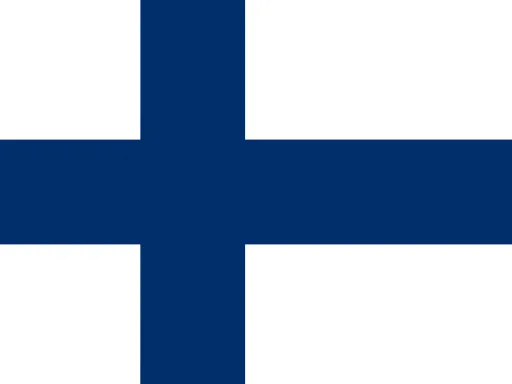 Finland | 5.6M | 336,884 | 17 | $317B | $56,149 | 82.4 | 43.4 |
| 121 | 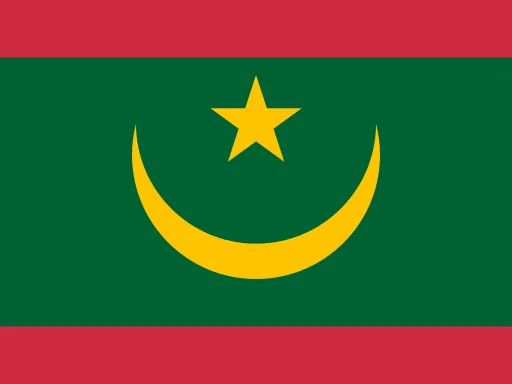 Mauritania | 5.5M | 1,030,700 | 5.3 | $11.7B | $2,198 | 69.2 | 17.5 |
| 122 | 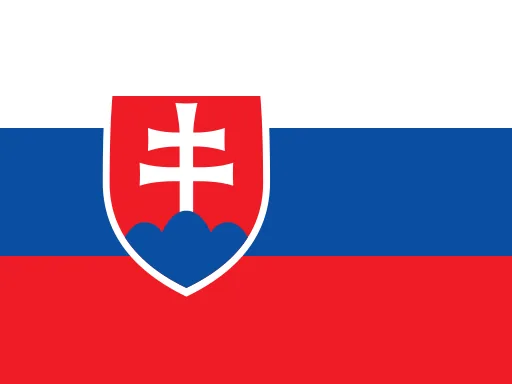 Slovakia | 5.5M | 49,035 | 111 | $154.5B | $28,544 | 78.8 | 42.8 |
| 123 | 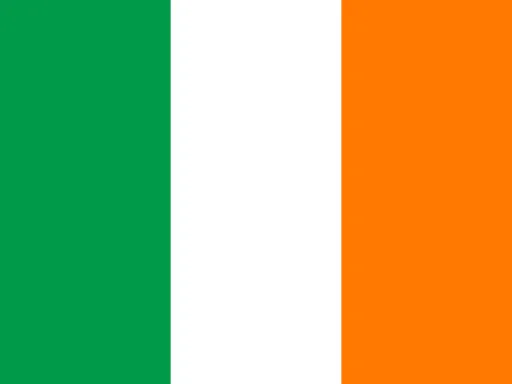 Ireland | 5.4M | 69,825 | 77 | $721.7B | $131,592 | 82.9 | 39.2 |
| 124 | 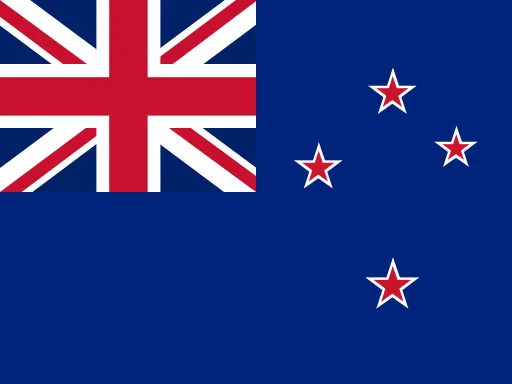 New Zealand | 5.3M | 268,164 | 20 | $264.1B | $49,591 | 82.5 | 38.0 |
| 125 | 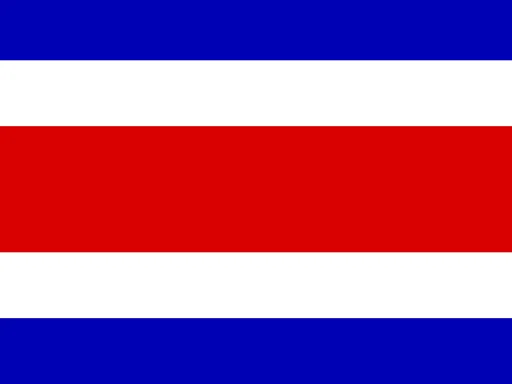 Costa Rica | 5.2M | 51,170 | 101 | $102.9B | $19,970 | 81.4 | 35.7 |
| 126 | 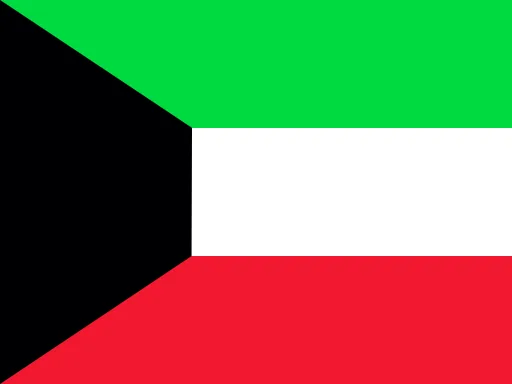 Kuwait | 5.1M | 17,818 | 286 | $157.2B | $32,312 | 81.0 | 34.8 |
| 127 |  Panama | 4.6M | 75,320 | 61 | $90.5B | $19,790 | 80.1 | 30.6 |
| 128 |  Croatia | 3.8M | 56,594 | 68 | $105.1B | $27,104 | 79.1 | 45.5 |
| 129 |  Georgia | 3.8M | 69,700 | 55 | $38.1B | $9,692 | 75.0 | 37.6 |
| 130 |  Eritrea | 3.7M | 121,144 | 30 | – | – | 69.4 | 19.5 |
| 131 | 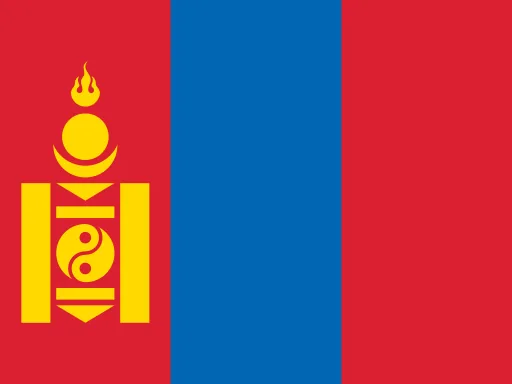 Mongolia | 3.6M | 1,564,116 | 2.3 | $25.4B | $7,108 | 72.5 | 27.0 |
| 132 | 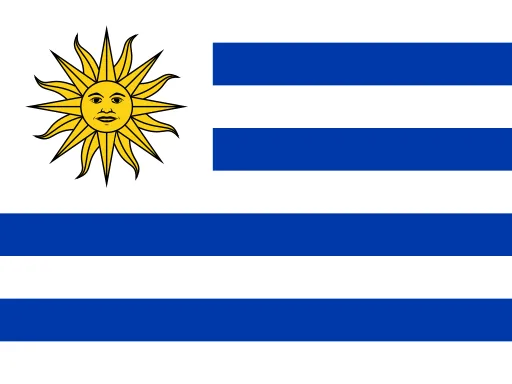 Uruguay | 3.4M | 173,626 | 19 | $85.3B | $25,216 | 78.6 | 36.7 |
| 133 | 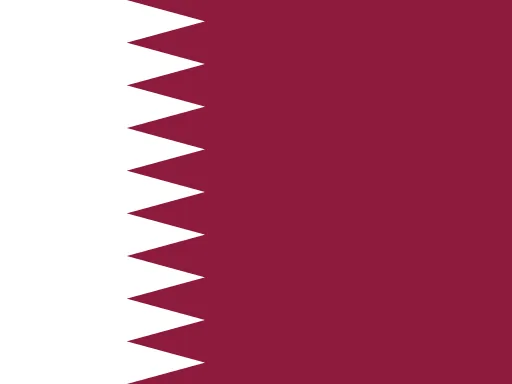 Qatar | 3.2M | 11,637 | 273 | $215.6B | $72,525 | 82.8 | 33.4 |
| 134 | 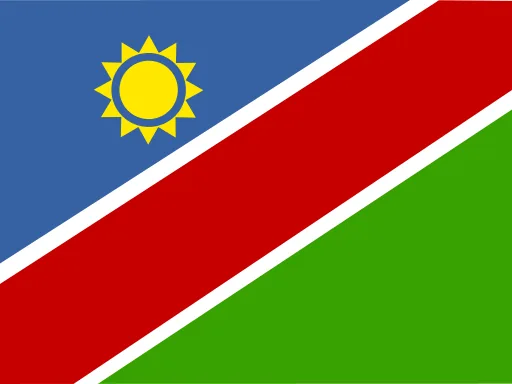 Namibia | 3.2M | 825,229 | 3.8 | $15.1B | $4,876 | 67.8 | 21.5 |
| 135 |  Bosnia and Herzegovina | 3.1M | 51,209 | 61 | $32.6B | $10,382 | 78.4 | 46.1 |
| 136 |  Moldova | 3M | 33,847 | 87 | $20.4B | $8,622 | 71.6 | 39.1 |
| 137 |  Armenia | 2.9M | 29,743 | 99 | $29.2B | $9,474 | 76.2 | 37.2 |
| 138 |  Gambia | 2.9M | 11,295 | 255 | $2.6B | $919 | 66.5 | 18.8 |
| 139 |  Jamaica | 2.8M | 10,991 | 258 | $22.7B | $8,003 | 71.9 | 33.3 |
| 140 |  Lithuania | 2.8M | 65,286 | 43 | $95.2B | $32,959 | 76.5 | 42.6 |
| 141 |  Albania | 2.8M | 28,748 | 96 | $30.5B | $12,998 | 80.1 | 37.8 |
| 142 |  Gabon | 2.6M | 267,668 | 9.9 | $21.4B | $8,263 | 68.9 | 21.6 |
| 143 |  Botswana | 2.6M | 581,730 | 4.5 | $19.9B | $7,778 | 69.6 | 23.7 |
| 144 |  Lesotho | 2.4M | 30,355 | 79 | $2.6B | $1,089 | 58.6 | 22.1 |
| 145 |  Guinea-Bissau | 2.3M | 36,125 | 64 | $2.5B | $1,124 | 64.6 | 19.6 |
| 146 |  Slovenia | 2.1M | 20,273 | 104 | $79.6B | $37,376 | 82.1 | 45.0 |
| 147 |  Equatorial Guinea | 2M | 28,051 | 71 | $12.8B | $6,615 | 64.3 | 20.9 |
| 148 |  Latvia | 1.8M | 64,594 | 28 | $48.6B | $26,312 | 76.6 | 43.8 |
| 149 |  North Macedonia | 1.8M | 25,713 | 70 | $19.1B | $10,490 | 77.8 | 41.4 |
| 150 |  Bahrain | 1.7M | 778 | 2,153 | $49B | $30,597 | 81.7 | 33.4 |
| 151 |  Trinidad and Tobago | 1.5M | 5,127 | 295 | $25.9B | $18,967 | 73.9 | 38.2 |
| 152 |  Timor-Leste | 1.4M | 14,954 | 96 | $1.9B | $1,341 | 68.3 | 22.1 |
| 153 |  Cyprus | 1.4M | 9,251 | 149 | $41.2B | $41,783 | 82.2 | 39.1 |
| 154 |  Estonia | 1.3M | 45,399 | 29 | $47B | $34,418 | 79.6 | 43.2 |
| 155 |  Eswatini | 1.3M | 17,363 | 73 | $5.2B | $4,108 | 64.5 | 22.7 |
| 156 |  Mauritius | 1.3M | 1,979 | 639 | $16.2B | $12,991 | 75.4 | 38.3 |
| 157 |  Djibouti | 1.2M | 23,200 | 52 | $4.6B | $3,906 | 66.6 | 25.2 |
| 158 | 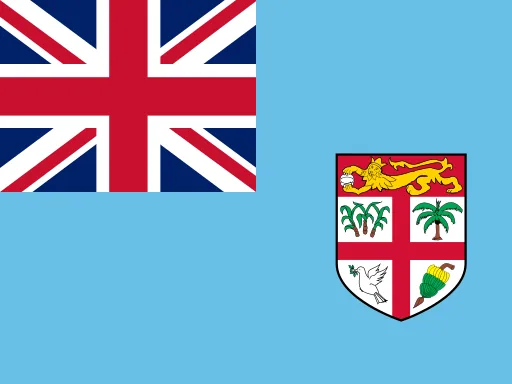 Fiji | 937,282 | 18,272 | 51 | $6.2B | $6,642 | 67.8 | 28.3 |
| 159 | 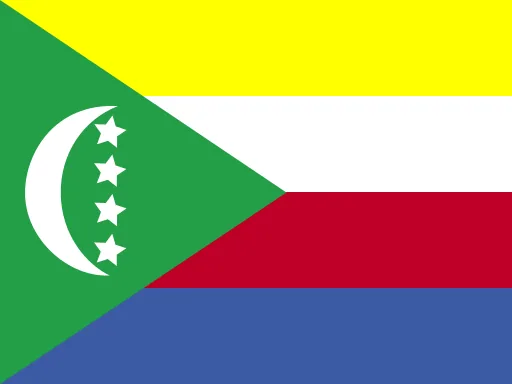 Comoros | 899,010 | 2,235 | 402 | $1.8B | $2,056 | 67.5 | 20.7 |
| 160 | 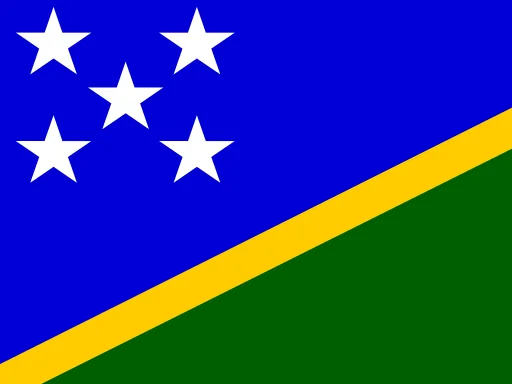 Solomon Islands | 858,288 | 28,896 | 30 | $1.7B | $2,086 | 71.0 | 20.9 |
| 161 | 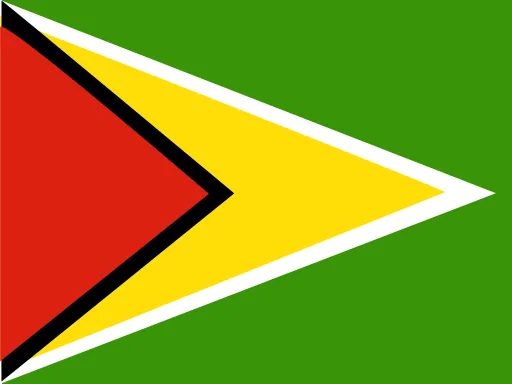 Guyana | 840,890 | 214,969 | 3.9 | $27.1B | $32,414 | 70.6 | 26.5 |
| 162 |  Bhutan | 802,214 | 38,394 | 21 | $3.6B | $4,493 | 73.8 | 31.0 |
| 163 |  Luxembourg | 687,448 | 2,586 | 266 | $101.2B | $147,252 | 82.6 | 39.7 |
| 164 |  Suriname | 645,256 | 163,820 | 3.9 | $4.5B | $7,070 | 74.0 | 28.9 |
| 165 |  Montenegro | 626,233 | 13,888 | 45 | $9.2B | $14,817 | 77.6 | 40.4 |
| 166 |  Malta | 549,011 | 315 | 1,743 | $27.8B | $47,907 | 83.8 | 41.5 |
| 167 |  Maldives | 531,517 | 300 | 1,772 | $7.7B | $14,615 | 81.7 | 33.4 |
| 168 |  Cabo Verde | 529,630 | 4,033 | 131 | $3.1B | $5,796 | 76.6 | 29.5 |
| 169 |  Brunei | 469,775 | 5,765 | 81 | $15B | $32,235 | 75.8 | 33.2 |
| 170 |  Belize | 428,644 | 22,966 | 19 | $3.3B | $7,865 | 74.1 | 27.3 |
| 171 |  Bahamas | 404,628 | 13,940 | 29 | $15.8B | $39,455 | 75.0 | 35.7 |
| 172 |  Iceland | 402,329 | 103,000 | 3.9 | $38.6B | $98,323 | 83.3 | 36.6 |
| 173 |  Vanuatu | 342,564 | 12,189 | 28 | $1.4B | $4,039 | 72.0 | 20.3 |
| 174 |  Barbados | 282,724 | 431 | 656 | $8B | $28,365 | 76.6 | 39.7 |
| 175 |  São Tomé and Príncipe | 244,994 | 964 | 254 | $981.3M | $4,084 | 70.3 | 19.7 |
| 176 |  Samoa | 220,528 | 2,842 | 78 | $1.3B | $5,873 | 72.1 | 19.8 |
| 177 |  Saint Lucia | 180,488 | 616 | 293 | $2.7B | $14,746 | 73.2 | 35.1 |
| 178 |  Kiribati | 138,445 | 726 | 191 | $349.2M | $2,559 | 66.9 | 23.0 |
| 179 |  Seychelles | 134,959 | 457 | 295 | $2.4B | $19,449 | 73.3 | 34.6 |
| 180 |  Grenada | 117,362 | 345 | 340 | $1.4B | $12,107 | 75.7 | 34.9 |
| 181 |  Federated States of Micronesia | 114,182 | 702 | 163 | $501.8M | $4,414 | 67.7 | 23.5 |
| 182 |  Tonga | 103,291 | 747 | 138 | $679.2M | $6,547 | 73.4 | 21.0 |
| 183 |  Saint Vincent and the Grenadines | 99,244 | 389 | 255 | $1.3B | $12,562 | 71.7 | 34.7 |
| 184 |  Antigua and Barbuda | 94,626 | 442 | 214 | $2.3B | $24,819 | 78.1 | 36.7 |
| 185 |  Andorra | 83,753 | 468 | 179 | $4.5B | $54,292 | 84.5 | 44.2 |
| 186 |  Dominica | 65,511 | 750 | 87 | $723.9M | $10,989 | 71.6 | 36.6 |
| 187 |  Saint Kitts and Nevis | 46,992 | 261 | 180 | $1.2B | $25,223 | 72.6 | 36.5 |
| 188 |  Liechtenstein | 40,368 | 160 | 252 | $8.9B | $220,167 | 84.1 | 44.7 |
| 189 |  Monaco | 38,087 | 2 | 19,044 | $11.1B | $288,002 | 86.7 | 53.1 |
| 190 | 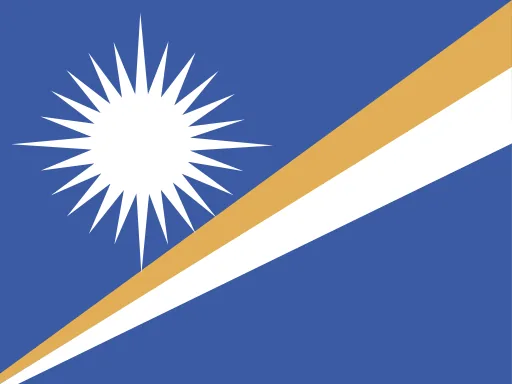 Marshall Islands | 35,075 | 181 | 194 | $308M | $8,489 | 67.3 | 20.5 |
| 191 | 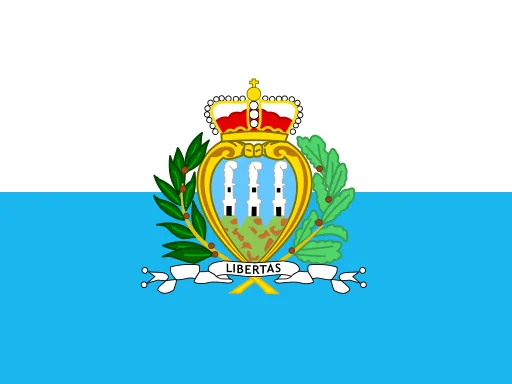 San Marino | 33,605 | 61 | 551 | $2B | $59,871 | 86.0 | 49.1 |
| 192 | 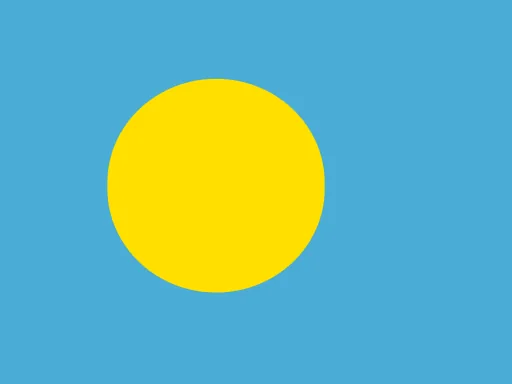 Palau | 17,614 | 459 | 38 | $345M | $19,532 | 69.6 | 38.9 |
| 193 | 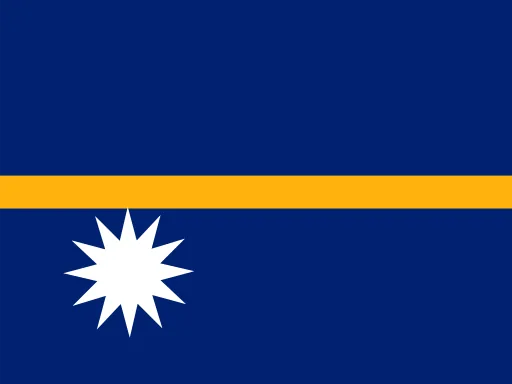 Nauru | 12,101 | 21 | 576 | $176M | $14,640 | 62.6 | 20.2 |
| 194 | 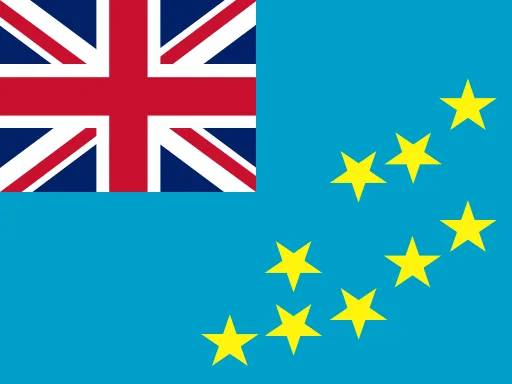 Tuvalu | 9,362 | 26 | 360 | $57.3M | $6,041 | 67.6 | 24.1 |
| 195 | 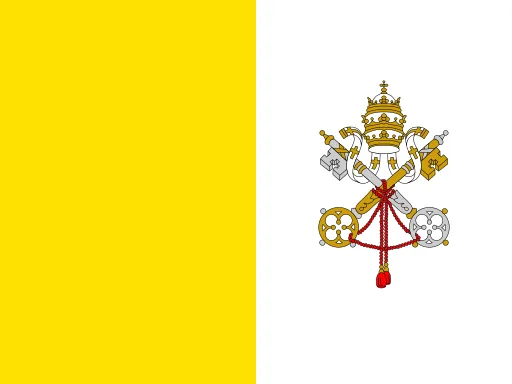 Vatican City | 506 | 0.44 | 1,150 | – | – | 83.4 | 56.2 |
World Population Prospects 2024 (United Nations, Population Division) · Demographic Yearbook 2024, table 3 (United Nations Statistics Division) · World Development Indicators: GDP (current US$) (World Bank) · World Development Indicators: GDP per capita (current US$) (World Bank) · World Development Indicators: surface area (sq. km) (World Bank, from FAO). How we check our data →